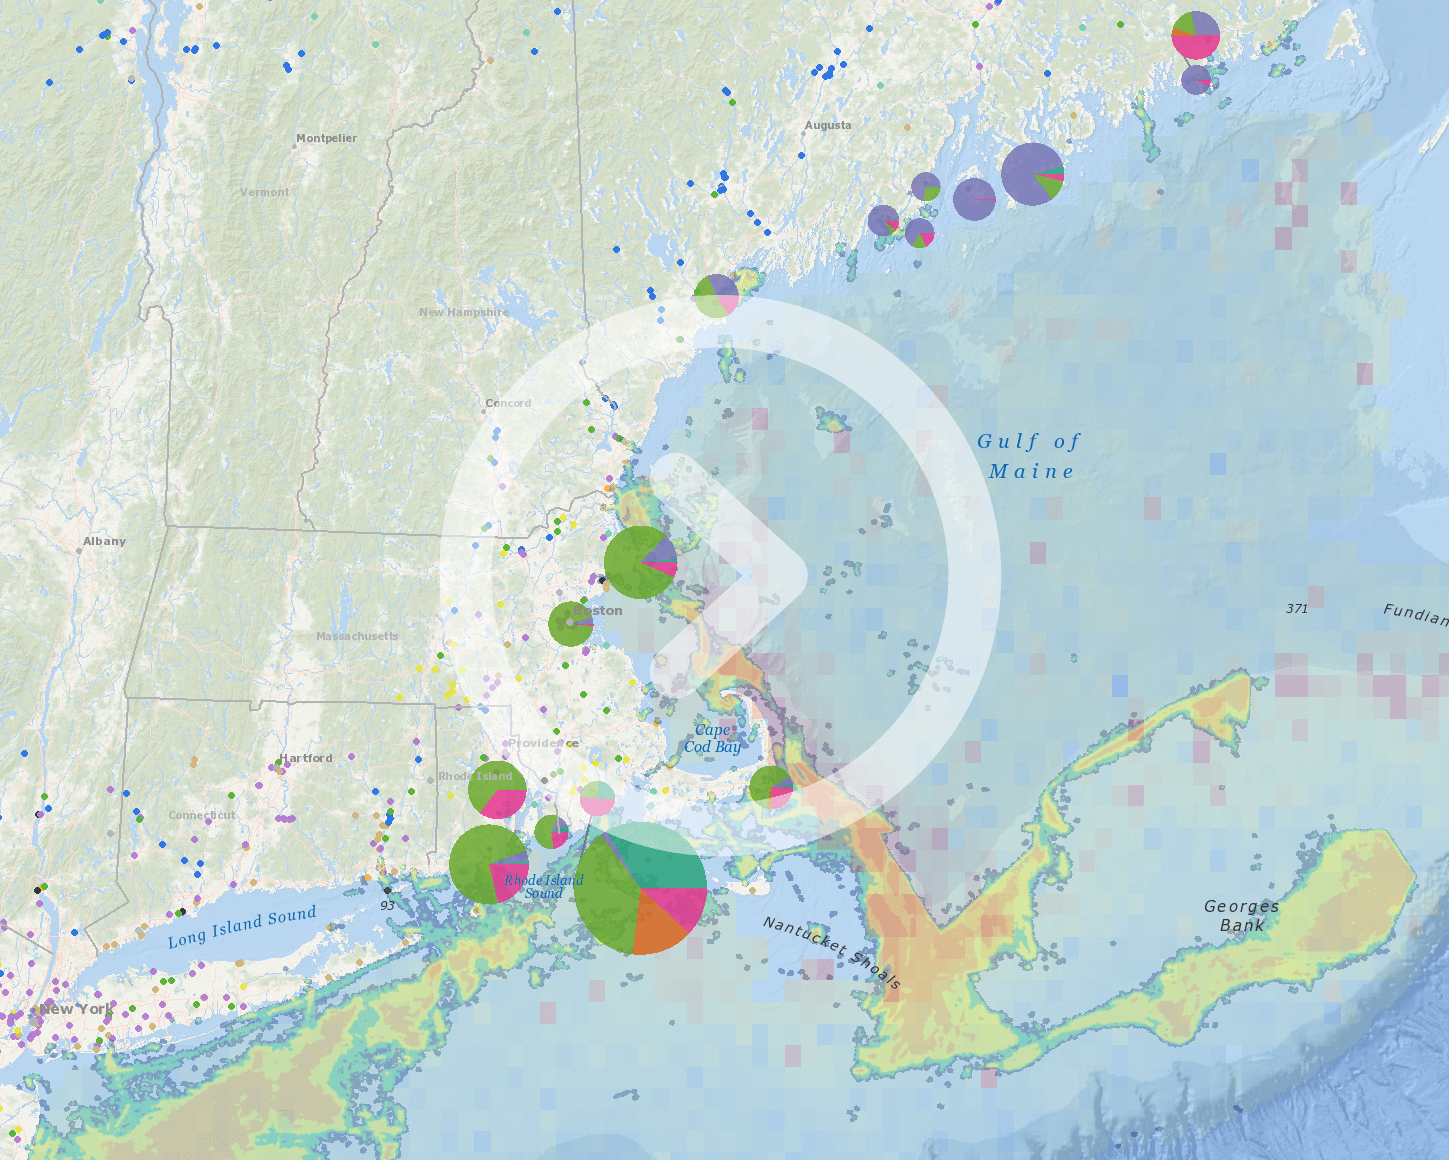
Bathymetry is the measurement of water depth and the shape of seafloor terrain. Just as topographic maps represent the three-dimensional features of dry land, bathymetric maps represent the land that lies underwater. High-resolution bathymetry data is some of the most-accessed and most-requested data on the Northeast Ocean Data Portal.

This example of high-resolution bathymetry data shows seafloor contours off the coast of Massachusetts from Nahant to Plum Island. Top center: Southern part of Jeffreys Ledge. Bottom center: Northern end of Stellwagen Bank.
To ensure that Portal users have access to the most recent and highest-resolution bathymetry data, the Bathymetry page has been recently updated and streamlined. There is now a new workflow to download the best available hydrographic-quality bathymetry data and to access other regional and local bathymetry and seafloor data resources. The updates and new features include:
- Quick access to the best available hydrographic-quality bathymetry data downloads via NCEI, through an interactive Data Explorer map showing the footprints of bathymetric surveys (see image below). This interactive map layer can be added to any Data Explorer map or users can access the map link from the Bathymetry page or the Data Downloads page. Clicking on any survey footprint will reveal the data download link in a popup window.

Screenshot of Data Explorer map showing the footprints of bathymetric surveys.
- Aggregation of the best available high-resolution local and regional bathymetry data and other associated seafloor mapping datasets for the Northeast U.S.
- Compilation of national-scale bathymetry, hydrography, and coastal topography data and resources from NOAA, US Army Corps of Engineers, and USGS
- Collection of information and resources about hydrographic survey and seafloor mapping planning
The new Bathymetry pages will continue to be updated as new data and resources are developed and added to Portal maps.
In addition, several groups of experts led by the Northeast Regional Ocean Council (NROC) or with NROC participation are continuing to advance the collection, compilation, synthesis, sharing, and uses of regional bathymetry and seafloor habitat data. Learn more about each of those efforts by visiting the links below.

Screenshot of Data Explorer displaying the Northeast region bathymetry composite 16-meter map layer.