Bathymetry & Seafloor
Bathymetry & Seafloor datasets relate to the shape, composition, biological activity, and depth below the sea surface of the seafloor. Bathymetry and seafloor data are used for navigational safety and charting, scientific research, and ocean planning. Data collected for navigational safety purposes must adhere to a specific set of standards and QA/QC procedures, whereas data collected for science and planning may not need to meet such rigorous criteria. Users should consult the metadata for each data product to understand intended uses. The data products within this topic are derived from many individual state, federal, and private sources. Within Bathymetry & Seafloor, Portal users can explore several subtopics.
Latest Updates
2025-04-09: Public Comment Opportunity: New England Shelf Hydrogeology Expedition
2025-03-27: New and Updated Seafloor Datasets
2025-01-10: New Coastal Resilience & Sand Category and Datasets
2024-04-30: Seafloor Mapping Plans for the Gulf of Maine
Data Providers and Sources
- Maine
- New Hampshire
- Massachusetts
- Rhode Island
- Connecticut
- New York
- NOAA National Centers for Environmental Information (NCEI)
- NOAA Office of Coast Survey
- NOAA Office for Coastal Management
- NOAA National Centers for Coastal and Ocean Science (NCCOS)
- NROC Habitat Classification & Ocean Mapping Subcommittee (HCOM)
- New England Fishery Management Council
- USGS
- UMass School of Marine Science & Technology
- University of New Hampshire
- INSPIRE Environmental
Subtopic
Benthic Communities
Benthic community data products visualize organisms’ presence on, within, or near the seafloor. These communities include deep sea corals and sponges, sea stars, snails, and sand dollars, for example. Data products in this subtopic include models and average abundances over many years.
Data Considerations
Benthic community data are relatively effort-intense to collect. Benthic communities can be characterized by collecting physical samples and via seafloor imagery (i.e., photos and video). Users should consult the metadata for each data product to obtain data provider contact information, methodological detail, and to understand intended uses.
Status
The data products and sources within this topic were reviewed by the NROC Habitat Classification and Ocean Mapping Subcommittee in 2025.
Examples of Data
- Deep-sea Soft Coral Habitat Suitability
- Seastar Average Abundance
Subtopic
Bathymetry Products
Bathymetry data products are processed and mosaicked bathymetry data. From the sources within this topic, data can be viewed/obtained for individual bathymetry survey patches and as aggregated regional scale products.
Federal sources of bathymetry data include:
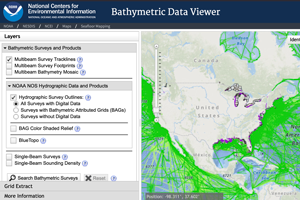
The Portal layer “NCEI – Surveys with Digital Sounding Data” shows multibeam survey footprints and provide download links from this source, which includes all of the bathymetry data archived at NCEI. Also available but not shown in the Portal are multibeam survey tracklines, singlebeam surveys, hydrographic surveys, crowdsourced bathymetry surveys, digital elevation models, and coastal lidar datasets.
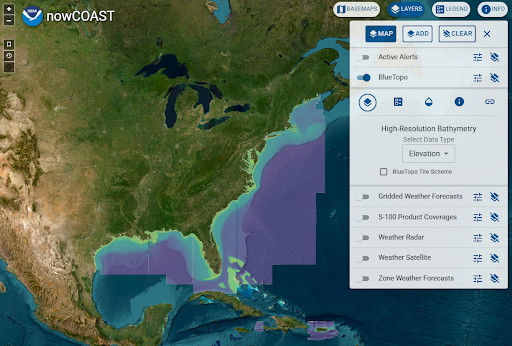
Office of Coast Survey BlueTopo
The Portal layers “BlueTopo” and “BlueTopo Tile Scheme” show a compilation of the nation’s best bathymetry data. BlueTopo provides consistently formatted bathymetry for the entire Atlantic coast along with metadata and several data quality metrics for each input survey/tile. BlueTopo is updated on a weekly to monthly basis according to regional rates of coastal change and availability of new sources data. The data in BlueTopo come from the NCEI bathymetry data archive.
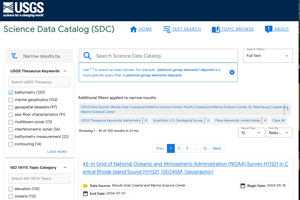
Bathymetry data collected by the USGS are archived in the Science Data Catalog. Some of the bathymetry composites listed below under “Other sources” include USGS data.
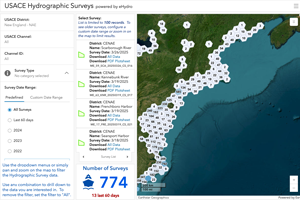
U.S. Army Corps of Engineers Hydrographic Surveys
This tool allows the download of hydrographic survey data that have been processed an uploaded by U.S. Army Corps of Engineers Districts.
Other sources of bathymetry data:
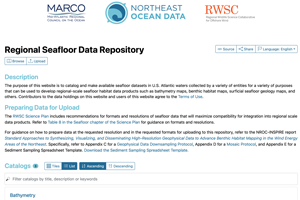
Regional Seafloor Data Repository
NROC and the Mid-Atlantic Regional Council on the Ocean (MARCO) support a Regional Seafloor Data Repository which includes uploads of bathymetry data from a variety of providers on the U.S. east coast who want to make their data available for research and ocean planning purposes.
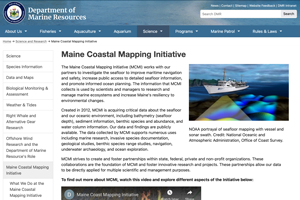
Maine Coastal Mapping Initiative
The Maine Coastal Program’s Mapping Initiative (MCMI) works with its partners to investigate the seafloor to improve maritime navigation and safety, increase public access to detailed seafloor information, and promote informed ocean planning.
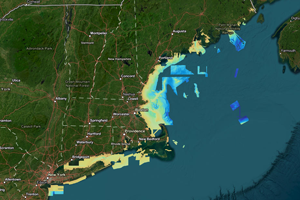
The Portal layers “Northeast region bathymetry composite” are composites of multiple datasets collected by federal, state, and private entities, provided at 4-meter and 16-meter resolutions.
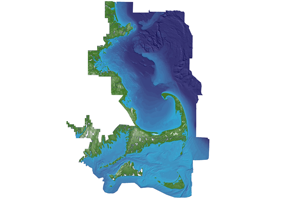
Continuous Bathymetry and Elevation Models of the Massachusetts Coastal Zone and Continental Shelf
Integrated terrain models covering 16,357 square kilometers of the Massachusetts coastal zone and offshore waters were built to provide a continuous elevation and bathymetry terrain model for ocean planning purposes.
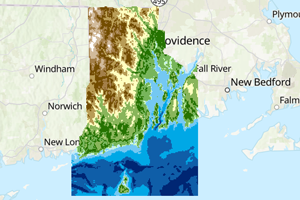
Continuous Topographic/Bathymetric Digital Elevation Model for the State of Rhode Island
This work sought to compile the best-available elevation and bathymetry data for the state, then construct a new, continuous topographic/bathymetric digital elevation model (DEM).
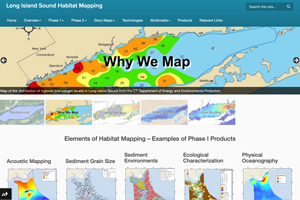
Long Island Sound Habitat Mapping Initiative
This web site provides information on the background and motivation for the mapping initiative, updates on the field activities conducted to date, interpretive story maps describing some of the results to date, and multimedia links to images and video of the beauty and complexity of the Sound.
Data Considerations
Bathymetry data shown on the Portal may be intentionally visualized at lower resolution than the highest resolution available for a variety of reasons (e.g., to ensure reasonable map loading time, to obscure the precise locations of certain sensitive seafloor features. Users should consult the metadata for each data product to obtain data provider contact information, methodological detail, and to understand intended uses.
Status
The data products and sources within this topic were reviewed by the NROC Habitat Classification and Ocean Mapping Subcommittee in 2025.
Examples of Data
- Bathymetric Contours
- Northeast Region Bathymetry Composite, 16m
- Global Bathymetry/Topography
Subtopic
Ongoing and Planned Surveys
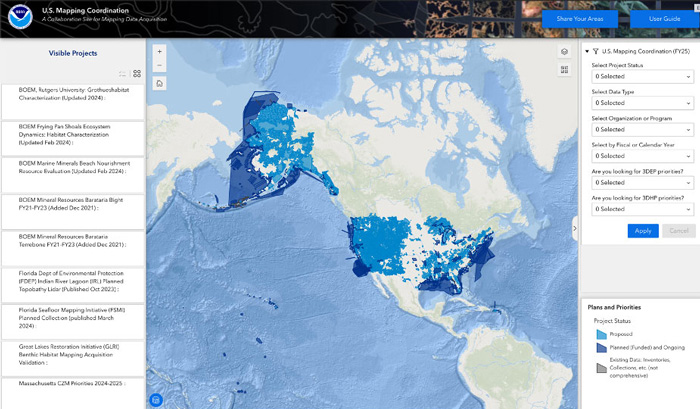
Partners across sectors are actively mapping parts of the seafloor in the northeast U.S. for a variety of reasons. The topic provides information about ongoing and planned seafloor surveys from entities that share this information with NROC or make it available publicly.
At the national scale, the Interagency Working Group on Ocean and Coastal Mapping (IWG-OCM) and the 3D Elevation Program (3DEP) are collaborating to coordinate mapping efforts across organizations from federal to local, academic, and private levels with the goal of facilitating collaboration between agencies to optimize mapping data acquisition, avoid redundancy, and ensure data meets multiple needs. A public coordination site includes tools to view and submit mapping requirements, priority areas, and preliminary acquisition plans for various data types including acoustic surveys, lidar, and digital imagery. For more information, contact iwgocm.staff@noaa.gov.
Data Considerations
Users should consult the metadata for each data product to obtain data provider contact information, methodological detail, and to understand intended uses.
Status
The data within this subtopic are continually updated. The data products and sources within this topic were reviewed by the NROC Habitat Classification and Ocean Mapping Subcommittee in 2025.
Examples of Data
- Planned NOAA Hydrographic Survey Areas (3-year outlook)
- Maine Seafloor Mapping Priorities 2024-2025
Subtopic
Seafloor Features & Geoforms
Seafloor features and geoforms data products are usually derived from some combination of bathymetry data and “ground-truthing” data (e.g., sediment samples, images of the seafloor). The Coastal and Marine Ecological Classification Standard (CMECS) is a structured catalog of ecological terms that also provides a framework for interpreting, classifying, and inter-relating observational data from all types of sensors and platforms. CMECS Geoform units describe the major geomorphic and structural characteristics of the coast and seafloor.
Data Considerations
The quality and accuracy of seafloor features and geoforms data products depends heavily on the quality of the input data. Users should consult the metadata for each data product to obtain data provider contact information, methodological detail, and to understand intended uses.
Many types of seafloor features and geoforms are static on long time scales (e.g., rocky zone), whereas some (e.g., sediment wave field) may be dynamic on much shorter time scales. Broadly, the extent of seafloor features and geoforms are thought to be mostly stable on decadal time scales. However, the exact extent and location of these features today may differ slight than those shown in the Portal.
Status
The data products and sources within this topic were reviewed by the NROC Habitat Classification and Ocean Mapping Subcommittee in 2025.
Examples of Data
- Seascapes – CMECS Geoform Category 1
- TNC NAMERA Seabed Forms
- Submarine Canyons
Subtopic
Sediment Products
Sediment data products represent the surficial composition of the seafloor, usually expressed as “grain size” or a classification of grain size (e.g., “sandy mud”). The Coastal and Marine Ecological Classification Standard (CMECS) is a structured catalog of ecological terms that also provides a framework for interpreting, classifying, and inter-relating observational data from all types of sensors and platforms. CMECS Substrate units describe the character and composition of surface and near-surface substrates.
Sediment data are collected by federal, state, and private entities. Some databases of sediment in the northeast U.S. include descriptions that are 200 years old.
The sediment data products in the Portal include point datasets of individual sediment observations as well as continuous models or maps of sediment types that are built using the sediment observations as one of many potential inputs.
Data Considerations
The quality and accuracy of sediment data and data products depends heavily on the age, collection method, and in the case of continuous models – the modeling methods and quality of the input data. Users should consult the metadata for each data product to obtain data provider contact information, methodological detail, and to understand intended uses.
Some seafloor environments in the northeast U.S. are more stable than others. Users can overlay data products that estimate sediment stability (Sediment stability, N m-2 (SMAST)) to understand how to potentially interpret a map of sediment types for a particular location.
Status
The data products and sources within this topic were reviewed by the NROC Habitat Classification and Ocean Mapping Subcommittee in 2025.
Examples of Data
- usSEABED Atlantic Coast Offshore Surficial Sediment
- TNC NAMERA Soft Sediments
- Southeast New England Regional Sediment
Subtopic
Fishing Effects
The datasets in this subtopic constitute the sediment data inputs and primary outputs from the Northeast Fishing Effects Model (Fishing Effects). Fishing Effects estimates the impacts of fishing with bottom-tending gears on seabed habitats throughout the Northeast region in both state and federal waters within the U.S. EEZ. Habitat impacts vary in space and time according to fishing gear type, the magnitude of fishing effort in each grid cell, and the types of geological and biological habitat structures inferred to each grid cell. These habitat structures are inferred based on substrate type and natural energy at a particular location. The types of structures assumed to occur in each grid cell influence the estimated susceptibility of the habitat to fishing and the estimated recovery times following impact.
The Fishing Effects model is based on the Swept Area Seabed Impact (SASI) model (NEFMC 2011) and a model developed by the North Pacific Fishery Management Council (Fujioka 2006). The SASI vulnerability assessment was published in 2014 by Grabowski et al. Fishing Effects is also used in the North Pacific region (Smeltz et al. 2019), and Fishing Effects Northeast was developed in collaboration with the developers of Fishing Effects North Pacific. The Fishing Effects Model was developed collaboratively by the New England Fishery Management Council’s Habitat Plan Development Team and the Fisheries, Aquatic Science, and Technology Laboratory at Alaska Pacific University.
Data Considerations
The primary purpose of the sediment maps is to serve as a base layer for the Fishing Effects model. Five different sediment grain sizes plus a steep and deep habitat type are represented in the dataset, which indicates the proportion of each grain size occurring within each 5×5 km grid cell based on available data (primarily from the USGS and SMAST drop camera survey dataset).
The Portal shows monthly model outputs for the 3 most recent years available (2015, 2016, 2017). The Fishing Effects model generated monthly data for 1996-2017.
Positional accuracy may vary according to positioning methodology in the underlying data sources. Note that Vessel Trip Reports often represent each fishing trip by a single latitude/longitude. Results are aggregated by Fishing Effects Model grid cell, with each cell having a resolution of 5×5 km.
The products are based on sediment samples collected between 1934 and 2018 and fishing activity occurring between 1996 and 2017.
There is no formally established threshold percentage indicating severe or significant vulnerability in a management context. In considering how these model outputs relate to real-world fishing activity, it is important to recognize that while fishing is distributed broadly across the Northeast-shelf region, activity with specific gear types is typically concentrated spatially. The percent disturbance results can be contrasted with the intrinsic vulnerability results to get a sense of the difference between the expected effects from moderate, uniform levels of fishing as compared to the percentages of disturbance that result from real-world concentrations of effort. Because the Fishing Effects model allows for recovery from disturbance, the percent disturbance will eventually trend toward zero in the absence of fishing effort, and locations with no effort from a particular gear type (fishery closure areas, or locations where that gear is simply not used) will show no disturbance associated with that gear.
Users should consult the metadata for data provider contact information, a detailed description of the Fishing Effects methods, and to understand intended uses.
Status
Fishing Effects Northeast was last updated in 2019, and another update is planned as part of the New England Council’s 2025 EFH Review.
Examples of Data
- Percent Sediment Type – Mud
- Percent Seabed Habitat Disturbance, All Gear Types (2015), Monthly
- Intrinsic Seabed Habitat Vulnerability To Fishing – Bottom Trawl, Median Fishing Effort