Maps of marine mammal, fish, and bird abundance and richness data from the Marine-life Data and Analysis Team effort are now available in our Data Explorer—a comprehensive map on which users can choose to view any combination of data on human activities, marine life, and the environment. With the addition of these data, it is now possible to overlay and visualize data on marine life distribution and abundance with other datasets. This new capability allows users to explore the distribution, abundance, biomass, and species richness of marine mammals, birds, and fish and their relationships with human uses such as recreation, marine transportation, and energy and infrastructure.
Overlaying marine life and human use data in this way can help advance our understanding of the interactions between humans and species groups, such as identification of potential effects. The Northeast Ocean Plan considers some of these potential comparisons and relationships by including maps and data for ecological-, regulatory-, and stressor-sensitivity-based groups of species.
The availability of the new marine life data in the Portal allows users to explore their own siting, management, regulatory, or research questions about marine life, habitats, and human uses, and to use stakeholder- and peer-reviewed data to begin to answer them.
Example: Whale Abundance and Whale Watching Areas
The total abundance of baleen whales—an ecological group under Marine Mammals—can be overlaid on a map of commercial whale watching areas:

Example: Birds and Offshore Energy
As an example of mapping a human activity along with a stressor-sensitivity species group, the relative abundance of bird species with higher collision sensitivity to offshore renewable energy structures can be mapped with BOEM wind planning areas and active renewable energy leases:

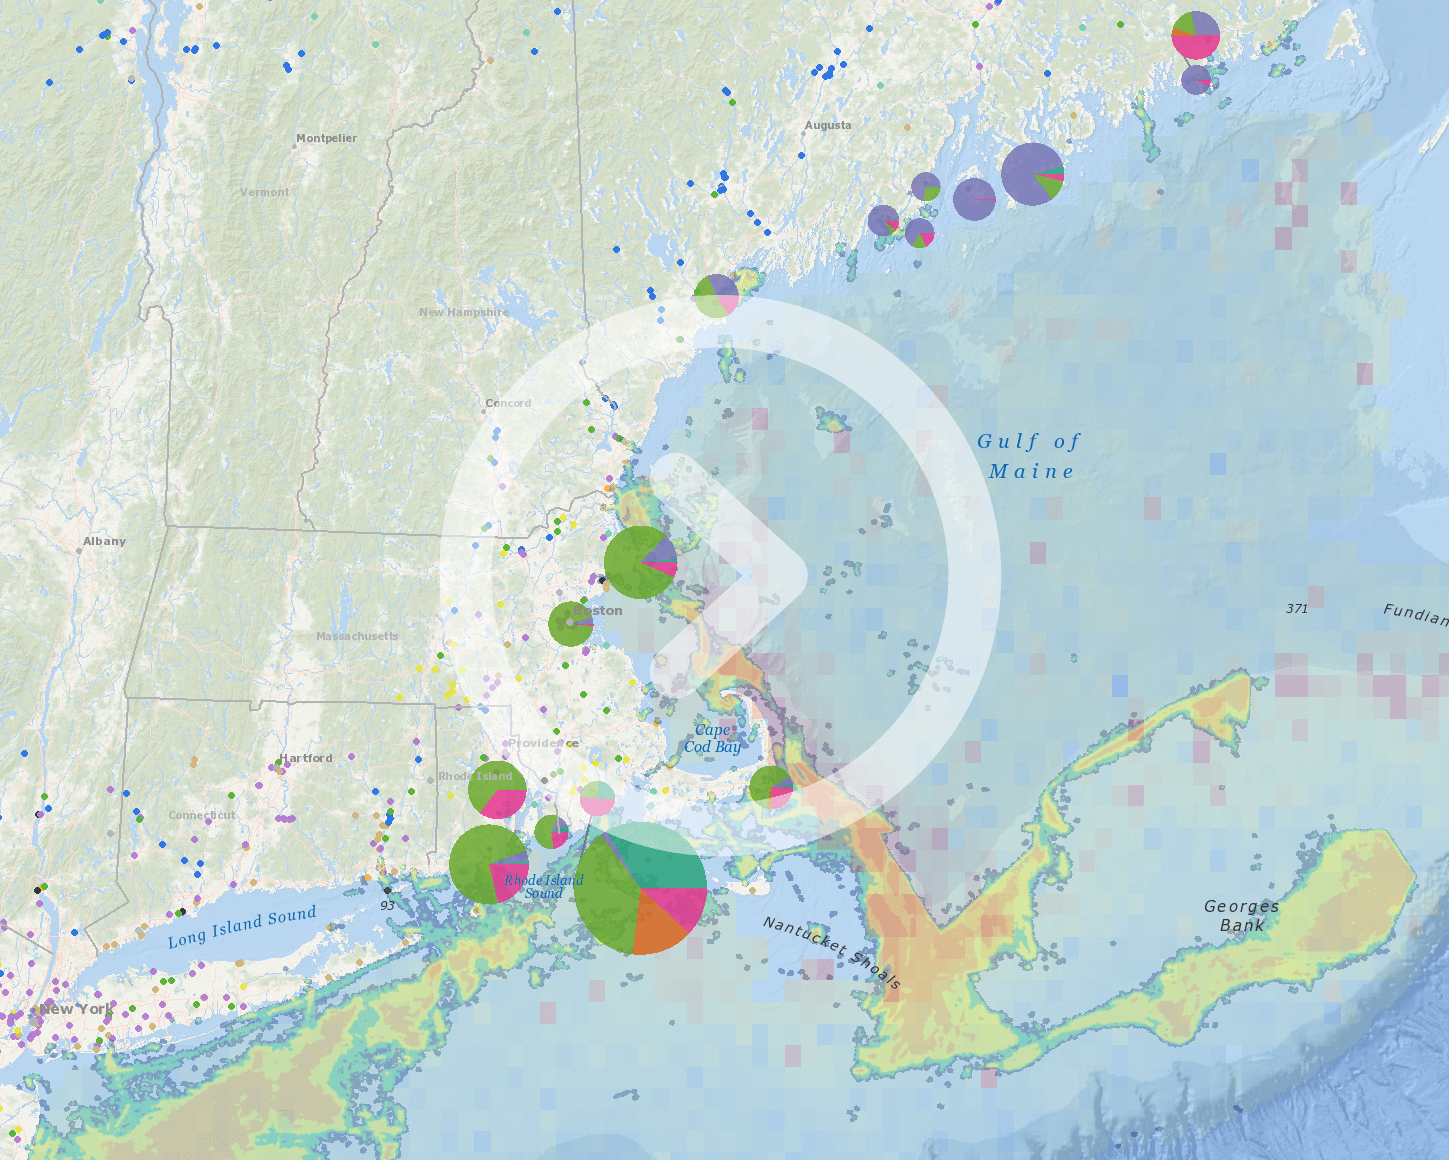
Example: Fish Biomass and Essential Fish Habitat
Similarly, the total biomass of fish species managed under the Northeast Multispecies Fishery Management Plan can be mapped along with designated Essential Fish Habitat (EFH) areas to examine a regulatory consideration:

The addition of the new marine life data to the Data Explorer also makes it possible to explore ecological relationships. By overlaying marine life data from one species group with data from another group, or overlaying marine life data with habitat data, the user can investigate potentially important ecological patterns. Currently, only maps of species groups—not individual species—are available in the Data Explorer. Maps of individual species (as well as species groups) are provided in the thematic maps for marine mammals, fish, and birds.