Northeast Ocean Data announces the release of updated maps of commercial fishing vessel activity featuring enhanced visualization of the latest data. In addition, we are releasing new maps that depict selected regulated fishery management areas for the scallop, herring, groundfish, surfclam/ocean quahog, and lobster fisheries.
Fishing Vessel Activity


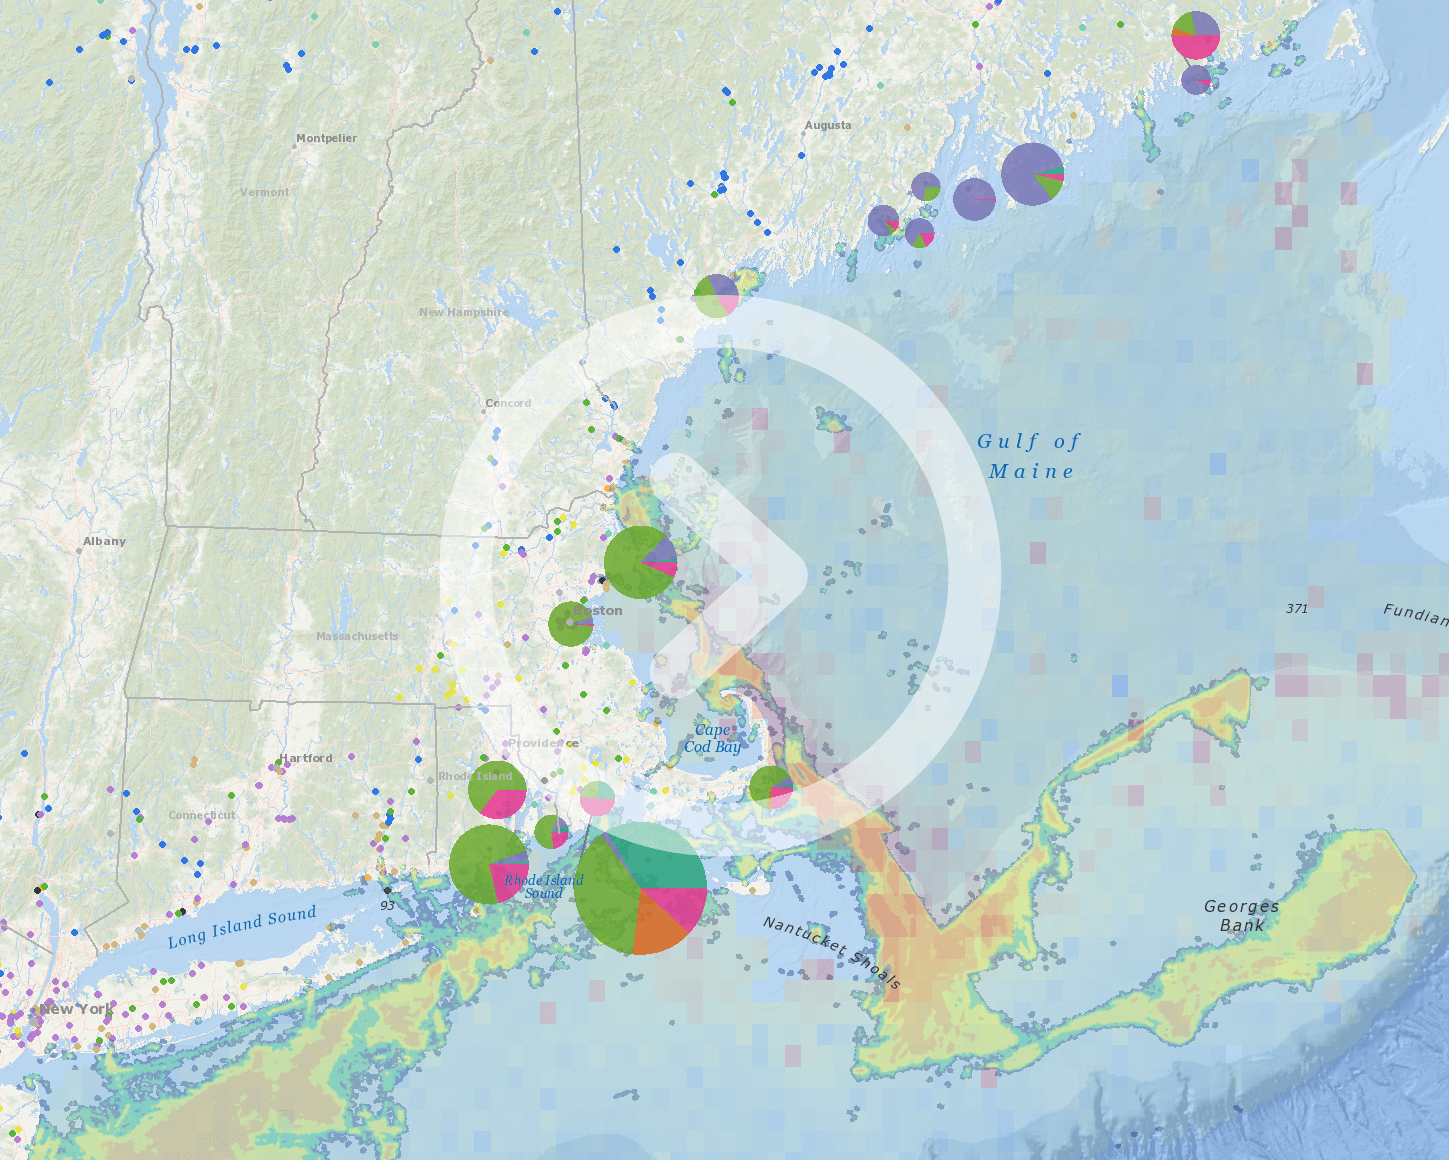
The fishing vessel activity maps are the product of a multi-year effort to spatially characterize commercial fishing activity in the northeastern United States based on Vessel Monitoring System (VMS) data acquired from the NOAA National Marine Fisheries Service (NMFS). VMS is a satellite communication system used to monitor the location and movement of fishing vessels operating in certain federally managed fisheries. To create these maps, we developed a new method of characterizing the VMS data that provides higher-resolution visualization while maintaining the strict data confidentiality required by NMFS. Included in this release are 19 maps that show vessel activity in 7 federally managed fisheries:
For 4 of the 7 fisheries, data are provided for 2006 through 2014, grouped into two time periods (2006-2010 and 2011-2014). For surfclam/ocean quahog, the data cover 2006-2010 and 2012-2014. For squid and mackerel, the maps show only 2014 because previous federal regulations did not require VMS for those 2 fisheries.
For each fishery, there is an option to show only vessel activity below a threshold speed, as an indicator of fishing activity rather than transiting or other vessel activities at higher speeds. The speed thresholds are 5 knots for the scallop fishery and 4 knots for all other fisheries. The thresholds are based on recommendations from the fishing industry and fishery managers to generally differentiate fishing from other vessel activities.
This release expands on an earlier phase of the project, which focused on 4 fisheries from 2006 to 2010.
Fishery Management Areas


The new maps of fishery management areas are based primarily on data from the National Marine Fisheries Service (NMFS) Greater Atlantic Regional Fisheries Office (GARFO). Some areas—such as those for lobster—are for fisheries managed by the Atlantic States Marine Fisheries Commission (ASMFC).
In response to stakeholder input and priorities for regional ocean planning, the Northeast Ocean Data Working Group developed the new maps to
- provide spatial reference and context for the maps of commercial fishing vessel activity,
- help website users understand the spatial patterns of vessel activity for particular fisheries, recognizing that management measures affect spatial patterns of fisheries, and
- show management areas suggested by stakeholders as potentially having an impact on the spatial footprint of fishing activity.
While the management areas were selected for their relevance to the maps of fishing vessel activity, spatial patterns of vessel activity shown on those maps also may reflect past regulations and area closures that are no longer in effect.
As shown in the example screenshots below, information about each management area is available in map annotations, by clicking on an area to see its name, and through highlighting of a selected area’s boundaries. Each layer’s descriptive pop-up window includes the date on which a regulated area officially became law or was most recently modified.


For information about how these data and maps are being developed with stakeholder input and used to support regional ocean planning, please visit the commercial fishing page on the Northeast Regional Planning Body’s website.