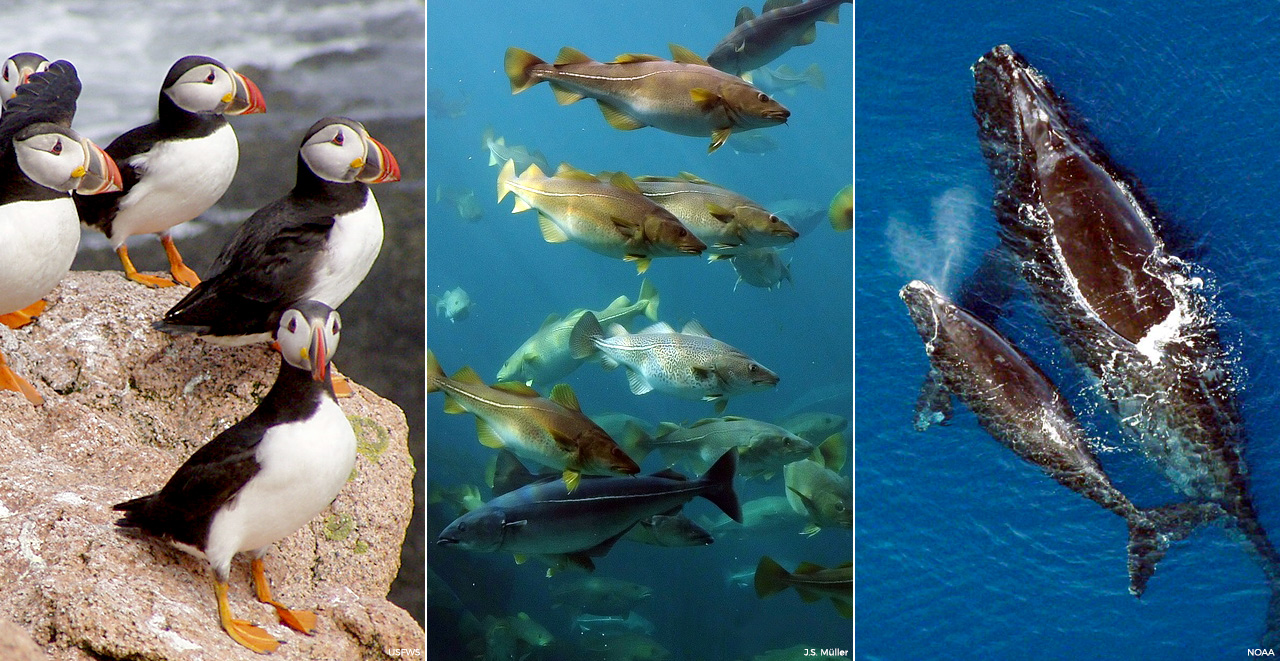
The Northeast Data Portal, in coordination with the Mid-Atlantic Ocean Data Portal, the Marine Cadastre, and the Marine-life Data and Analysis Team (MDAT) announce the release of updated (“Version 2”) marine life data products. Roughly 3,000 maps showing populations and abundance for individual species of fish, birds and mammals along the Atlantic coast comprise the suite of updated marine life data products generated by MDAT to support ocean planning.
Go directly to the marine life tutorials:
- Introduction to Marine Life and Habitat Theme Maps
- How to Add an Individual Species to the Data Explorer Map
Overview of What’s New
The original Version 1 marine life data products were released in 2016 in conjunction with the Northeast Ocean Plan. New Version 2 products reflect planned updates to cetacean and bird individual species-level data products by MDAT member groups including the Duke Marine Geospatial Ecology Lab with support from the U.S Navy, and the NOAA National Centers for Coastal and Ocean Science (NCCOS) with support from the Bureau of Ocean Energy Management (BOEM), respectively. Another MDAT member group, the NOAA Northeast Fisheries Science Center, contributed to updates to fish species group products. Work to develop and present Version 2 MDAT products involved the collaboration and coordination of state and federal agencies, scientific experts, and other ocean planning stakeholders.
Broadly, the updates and changes in Version 2 marine life products include:
- new and recent marine life observations, such as observations from the NOAA Atlantic Marine Assessment Program for Protected Species (AMAPPS);
- new Individual Species products for seven bird species that were not previously included;
- a new Individual Species product for a cetacean species (Cuvier’s beaked whale) that was previously only modeled as part of a guild;
- new Species Group products for fish showing the distribution of some species (Stressor Groups) that are particularly vulnerable to climate change stressors; and
- updates to all other Species Group products (such as Total Abundance, Total Biomass, and Species Richness products for Ecological Groups, Species of Concern Groups, and Stressor Groups) for mammals, birds, and fish using refined calculation methods.
In addition, Version 2 marine life products have a new look and feel, as they are now displayed using color scales that better represent the data, are easier to read by those with visual impairments, and print well in grey-scale.
As with Version 1, Version 2 marine life products have been extensively reviewed by experts in each topic and are accompanied by updated technical documentation and complete metadata which provide citations to relevant peer-reviewed reports and papers. MDAT also updated the technical report that combines information about the methods used to develop the datasets and maps into a single document. Links to the technical report and metadata are provided when viewing the data on Northeast Ocean Data.
The following documents provide detailed descriptions of updates and changes in Version 2 for each taxa:
- MDAT Cetacean Product Updates Summary of Changes
- MDAT Avian Product Updates Summary of Changes
- MDAT Fish Product Updates Summary of Changes
Webinar
Join us on Friday, Sept. 28, at 11:00 a.m. for a free public webinar about the updated marine life data. The webinar will include a special tour of the interactive maps, presentations on how the data were aggregated, demonstrations of how to find and use the maps, and a Q&A with the presenters. Participants can attend the webinar at https://monmouth.adobeconnect.com/mdat2/. Advance registration is appreciated but not required: https://www.eventbrite.com/e/webinar-mapping-marine-life-on-the-east-coast-tickets-49057437115.
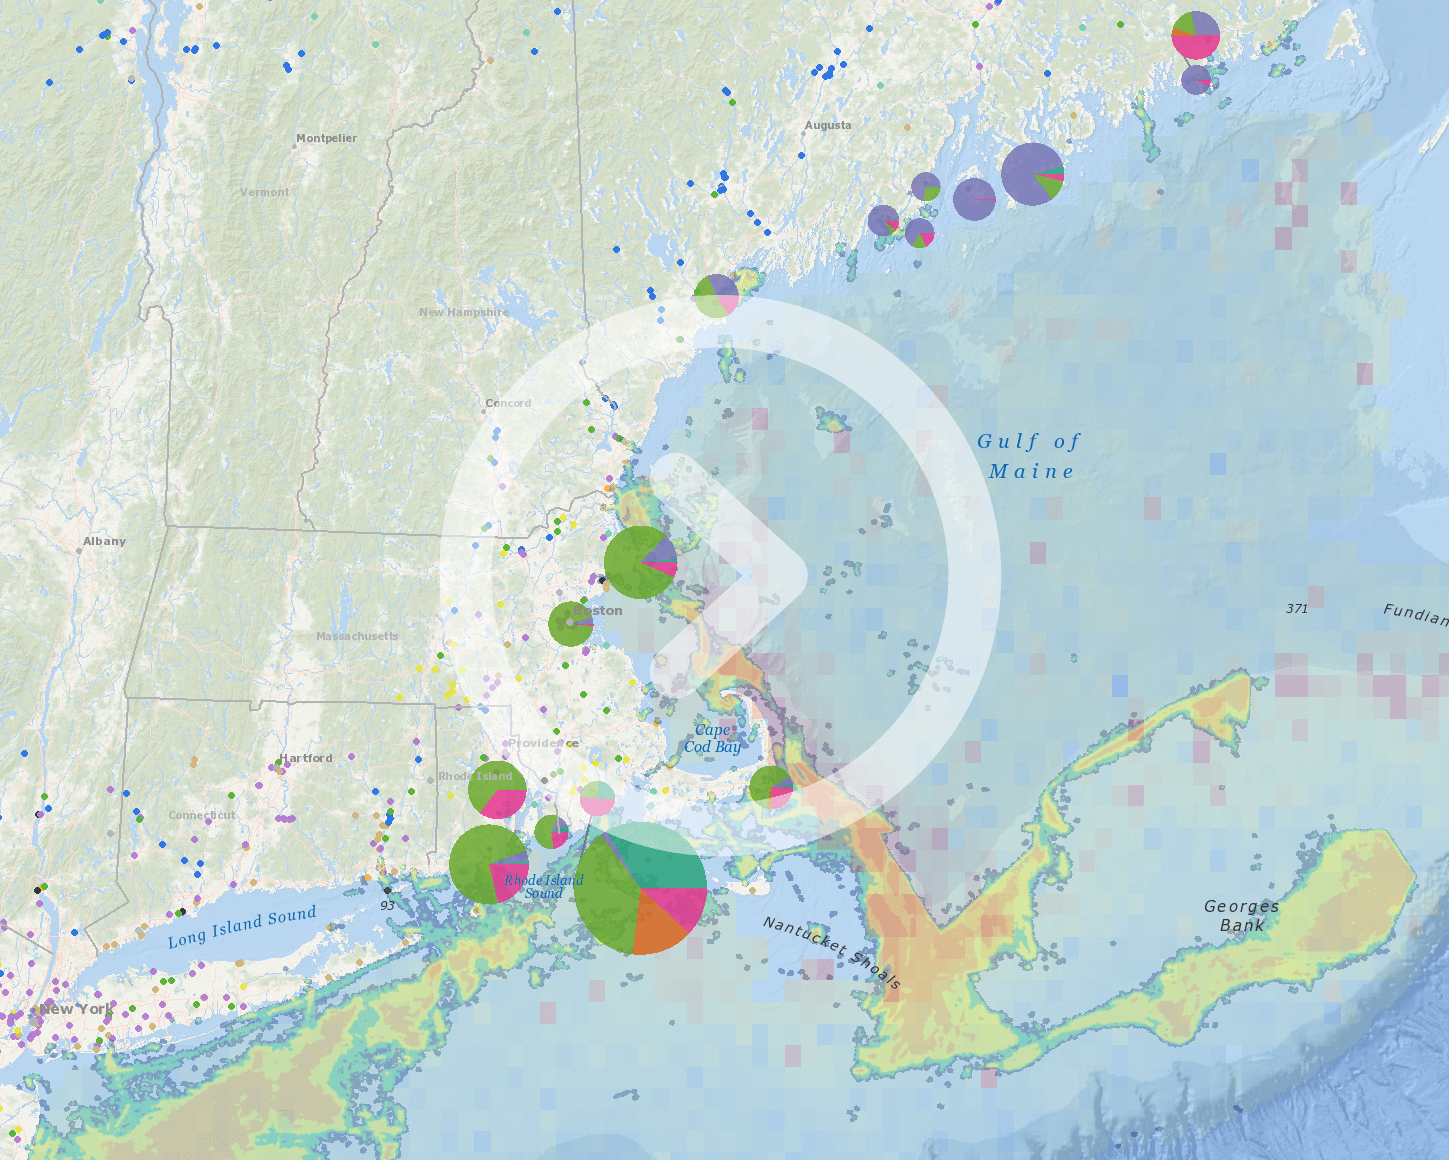
Examples of New and Updated Maps
Below are maps of total abundance (cetaceans and birds) and total biomass (fish), as well as examples of Individual Species maps (North Atlantic right whale, common eider), an Ecological Species Group map (baleen whales), a Species of Concern Species Group map (state-listed bird species of concern), and Stressor Species Group maps (fish with abundance or distribution vulnerable to climate changes). Click on any of the map images to open an interactive version in the Data Explorer.
All Cetacean Species: Total Abundance
All Bird Species: Total Abundance

All Fish Species: Total Biomass

North Atlantic Right Whale: Average Density (August)
Baleen Whales: Species Richness (Annual)
Common Eider: Predicted Relative Density (Spring)
Northeast State-Listed Bird Species of Concern: Total Abundance (Annual)
Total Biomass of Fish Species with Abundance Vulnerable to Climate Changes (NEFSC Fall)
Total Biomass of Fish Species with Distribution Vulnerable to Climate Changes (NEFSC Fall)