A new update on the Northeast Ocean Data Portal provides users with additional options for basemaps and visualization options for NOAA charts.
Basemaps are the maps “under” the many customizable layers that users can select and visualize in Theme Maps and the Data Explorer. New basemaps in this update include a Dark basemap which provides increased visual contrast with layers such as Eelgrass Beds, and a Topo basemap that could be used to show contextual information on land with layers such as the newly updated Parks and Reserves data, for example.
Dark Basemap with Eelgrass Beds

Topo Basemap with Parks & Reserves

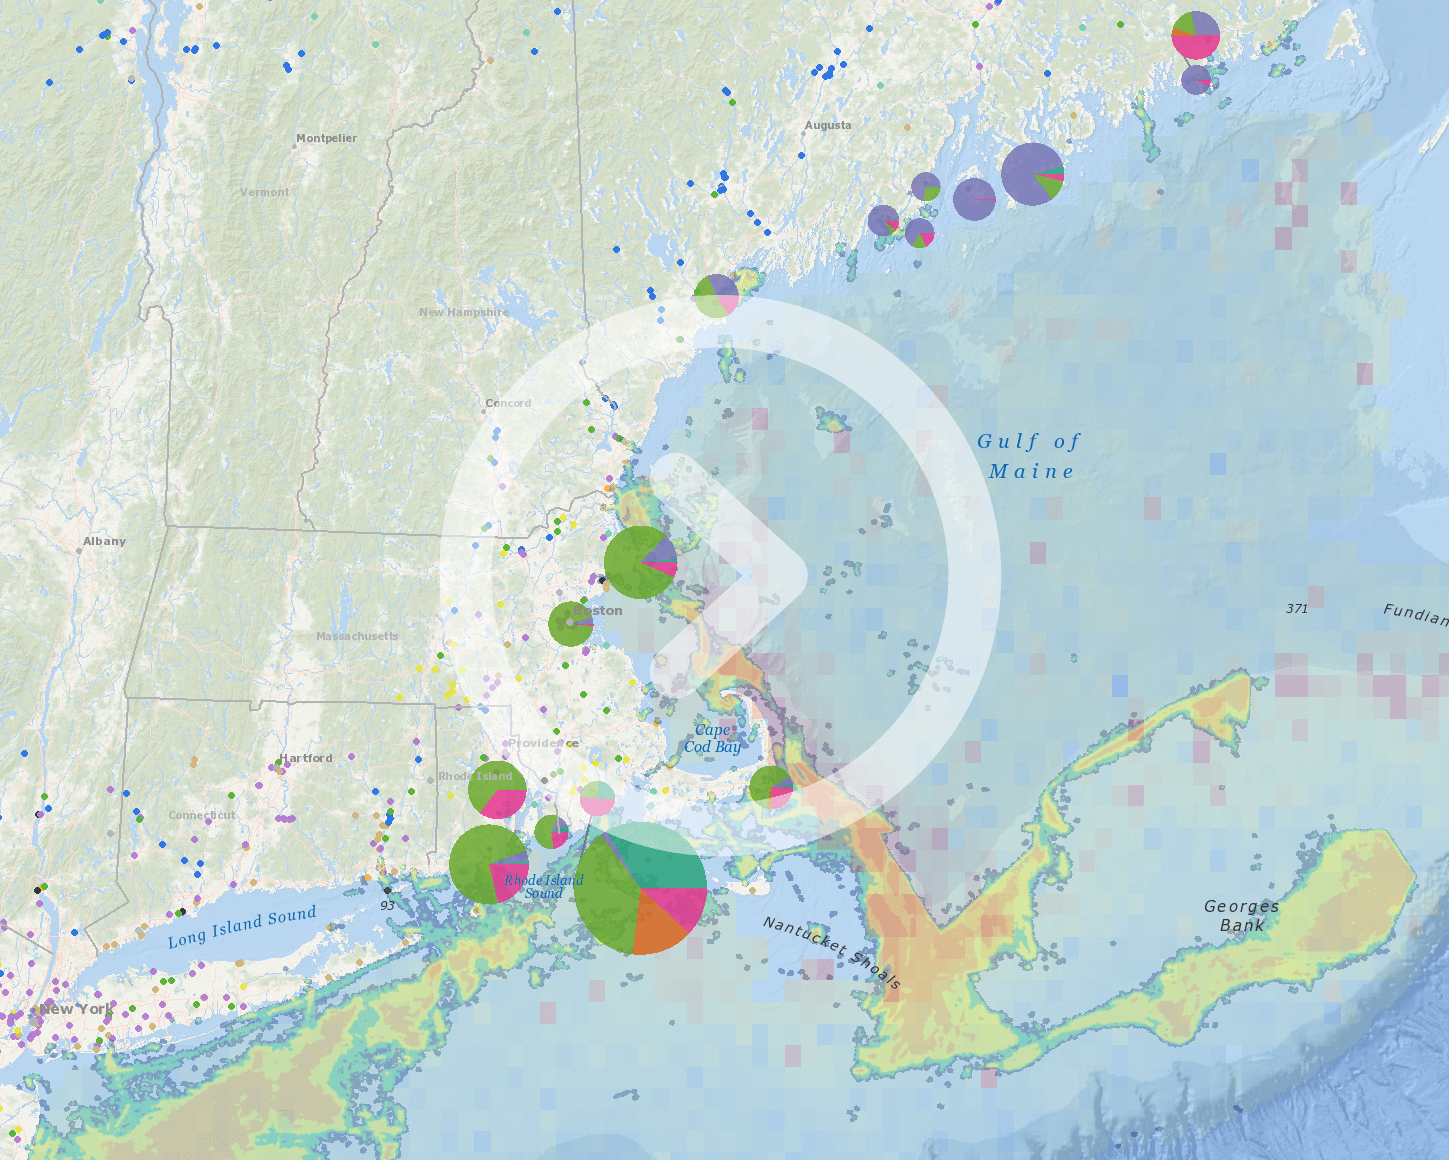
NOAA nautical charts have also been and are still available as basemaps, but now they are now also available as a stand-alone layer in the Navigation subcategory of Marine Transportation. As a layer, NOAA nautical charts can be overlaid on top of other basemaps and their transparency can be adjusted. This enables users to create interesting visualizations, such as this example for mapping coastal aquaculture sites in Fisher’s Island Sound (Connecticut):

The NOAA Charts layer automatically adjusts to the users’ zoom level in the map to show the optimal amount of detail.
Regional Scale

Local Scale