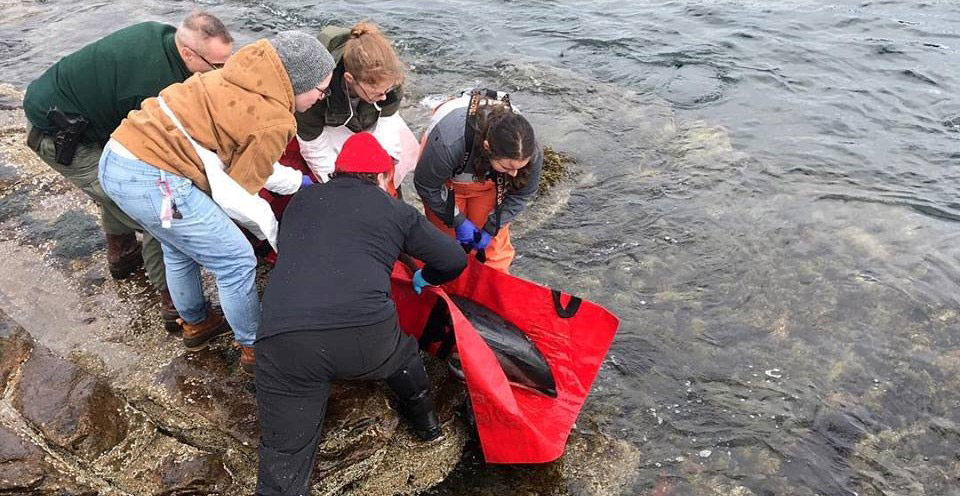
A team from Allied Whale, a federally licensed marine mammal stranding response group at the College of the Atlantic, returns a white-sided dolphin to the ocean after it was found beached on Mount Desert Island, Maine. Photo: COA
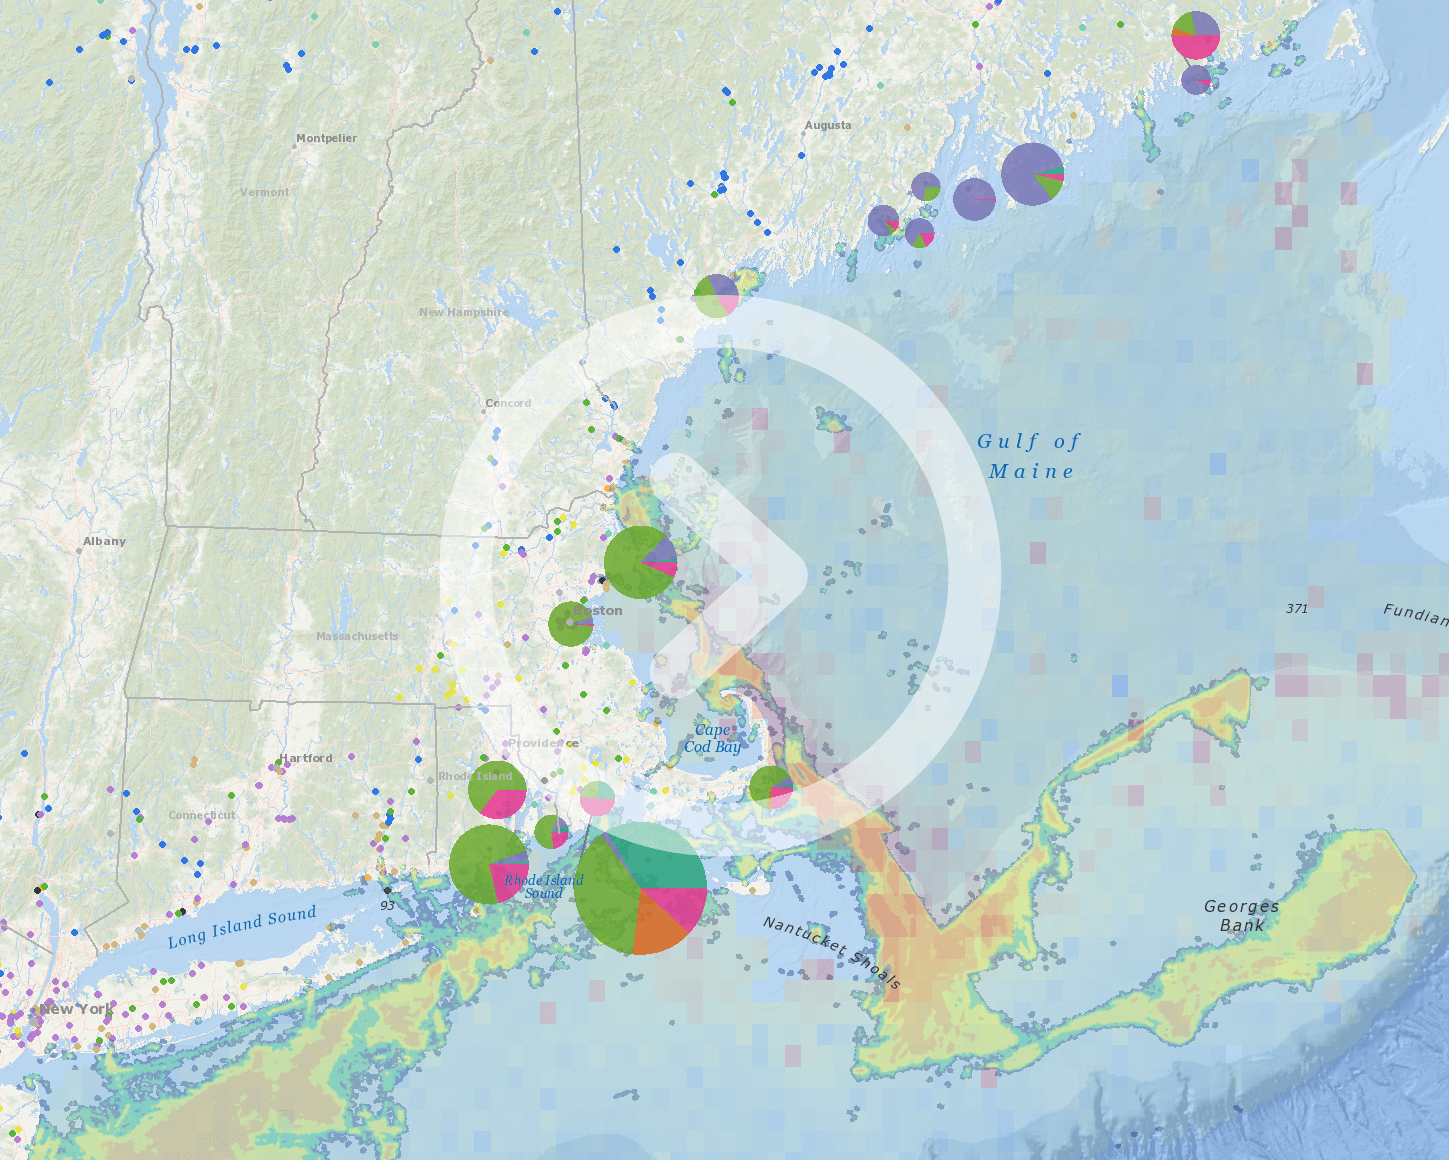
Using new data developed and published by the Mid-Atlantic Ocean Data Portal, a series of new maps shows the locations of marine mammal stranding events reported over the course of two decades from Maine to Virginia. The maps were created with data maintained by the National Oceanic and Atmospheric Administration (NOAA) Marine Mammal Health and Stranding Response Program and gathered by members of the U.S. National Marine Mammal Stranding Network.
The maps, which can be accessed in the Marine Mammals & Sea Turtles category in the Data Explorer, depict information recorded by stranding network responders between 2000 and 2020 through a process known as Level A data collection. Scientists and natural resource managers use the information to help promote the conservation of marine mammal species, as well as to respond to and mitigate threats to marine mammal populations. Individual stranding events are documented, providing important insight into natural history, life history, and the health of species. Long-term data collection allows for the analysis of trends and informs conservation and management efforts.
The new map layers on the Portal include:
- Marine Mammal Strandings County Summaries: This map provides the number of overall stranding events reported by county. Orange circle icons floating over each county are sized commensurate with the number of strandings.
- Marine Mammal Strandings by Species-Group: Users can activate any combination of seven map layers showing sites where strandings were reported for North Atlantic right whales, humpback whales, dolphins, porpoises, seals, other whales, and unidentified marine mammals.
- Marine Mammal Strandings by Season: These four maps depict where stranding events for all marine mammal types were reported in the winter, spring, summer and fall. Users can activate them one at a time or view data for multiple seasons at once.
When displaying any of the species/group or seasonal map layers, Portal users can click on any point for a pop-up containing information collected by responders, such as the animal’s species, observed condition, the incident date and report number. The maps do not provide information on the cause of death in mortality events. Further information on particular stranding events may be obtained by contacting the stranding network organization that responded.

Marine Mammal Strandings: County Summaries (2000-2020)

Marine Mammal Strandings: By Species-Group (2000-2020)

Marine Mammal Strandings: By Season – Summer (2000-2020)