“The Northeast Ocean Data Portal gave us critical pieces of information that helped us make our decision for where to locate the buoy.”
Tom Shyka
Northeastern Regional Association of Coastal Ocean Observing Systems (NERACOOS)
Northeast Ocean Data Portal User:
Northeastern Regional Association of Coastal Ocean Observing Systems (NERACOOS)
In Consultation with:
Massachusetts Department of Environmental Protection
NOAA National Ocean Service
NOAA National Weather Service
Northeast Marine Pilots Association
U.S. Army Corps of Engineers
U.S. Coast Guard
U.S. Geological Survey
Objective:
To identify the best location for a new wave-sensor buoy in Cape Cod Bay to provide data for ship pilots, weather forecasters, fishermen, whale watch operators, recreational boaters, habitat restoration practitioners, and others.
Related Ocean Uses:
![]()
Published: May 19, 2017
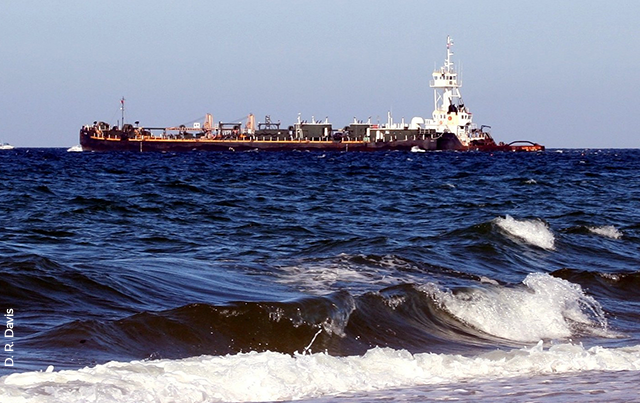
Ships, tugs, and barges carry more than a billion gallons of petroleum through Cape Cod Bay every year. To ensure safe and efficient passage across those heavily trafficked waters, captains and pilots require accurate, up-to-date information about sea conditions.
“Ninety-five percent of loaded tugs and barges pass eastbound through the Cape Cod Canal, and it is critical that we know what the sea-state is in Cape Cod Bay before we enter the canal,” said Captain Clint Walker of the Northeast Marine Pilots Association.
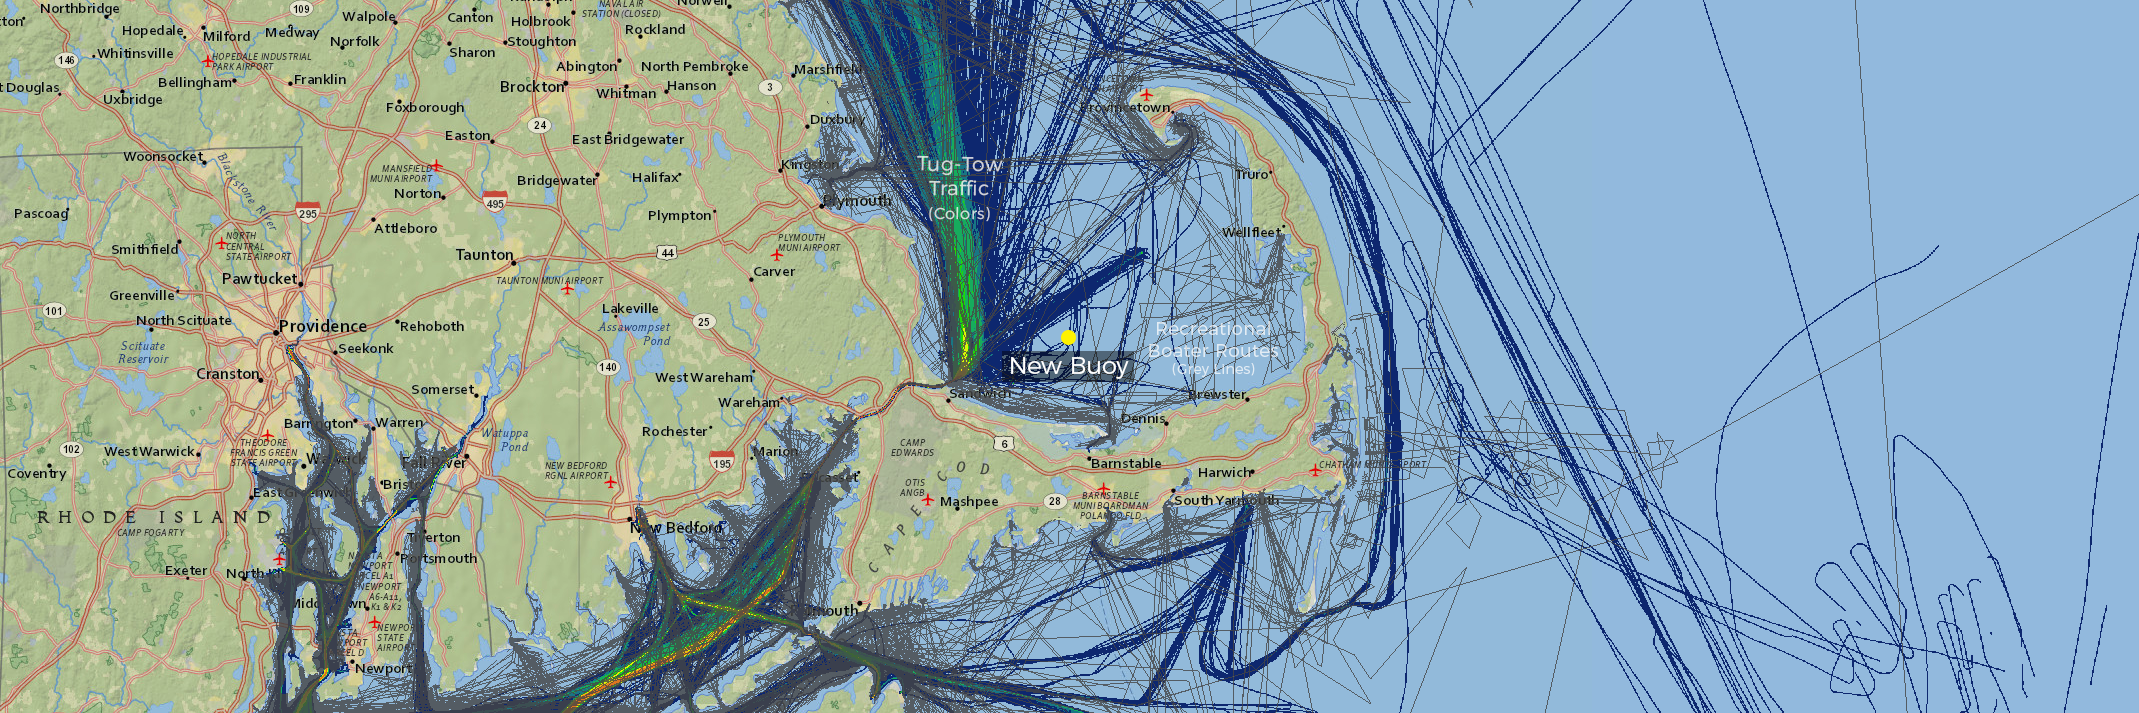
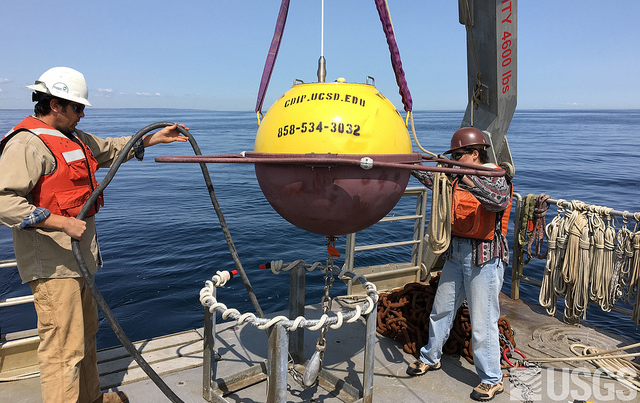
Until 2016, however, no real-time data on wave conditions were available for Cape Cod Bay. That’s when the Massachusetts Department of Environmental Protection (MassDEP), NOAA’s National Ocean Service, and several other partners provided financial and logistical support to deploy a new high-tech wave-monitoring buoy approximately six nautical miles north of Sandy Neck in Sandwich, Massachusetts. The location for the buoy was selected based in part on data and maps from the Northeast Ocean Data Portal.
Choosing where to place the buoy presented a number of challenges, according to Tom Shyka of the Northeastern Regional Association of Coastal Ocean Observing Systems (NERACOOS), which collaborated with the other partners to plan the deployment. NERACOOS is responsible for long-term operation of the buoy and delivers the data on its website. The wave sensors needed to be near the main routes through the Bay to provide useful data for the shipping industry. Yet the high-tech buoy—which is relatively small, can easily disappear from sight in a wave trough, and will cost up to $440,000 to acquire and operate for 5 years—could not be placed in a heavily trafficked area because of the risk of collision.
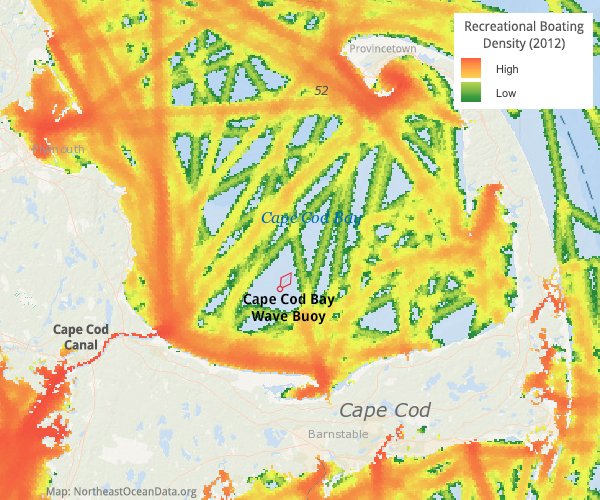
Additional factors needed to be taken into account to maximize the value of the data to other users, such as the National Weather Service, U.S. Coast Guard, U.S. Geological Survey, Army Corps of Engineers, fishermen, recreational boaters, and whale-watching tour operators. To help the partners make a well-informed decision, Shyka turned to the Northeast Ocean Data Portal for recent data on commercial ship traffic and recreational boating activity.
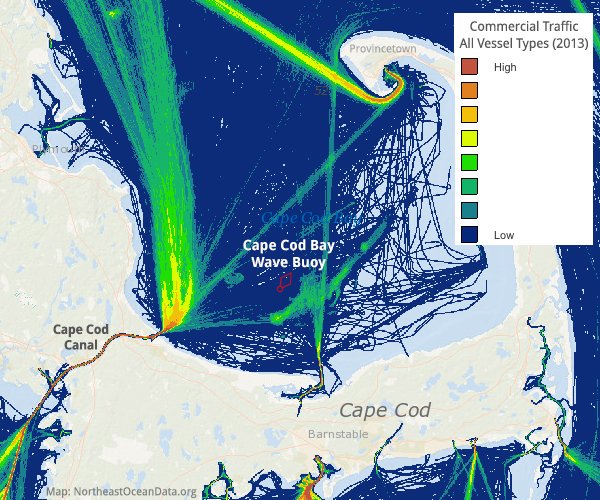
NERACOOS and partners used maps of commercial vessel traffic to identify a low-traffic area for siting the new wave-monitoring buoy.
On an interactive map of these data, he used the “draw” tool to indicate potential locations for the buoy, generated a static image of the maps, and emailed it to the project partners. In a subsequent web-conferencing session using the Portal, the group viewed the online map together and evaluated potential locations while interacting with the data. The Portal’s data and maps, along with other information sources, enabled the partners to agree on the location north of Sandy Neck.
Related Interactive Maps
with:
Commercial Vessel Traffic: All Vessel Types
Commercial Vessel Traffic: Tug-Tow
Recreational Boater Routes and Boating Density
Commercial Whale Watching Areas
Commercial Fishing Vessel Activity: Multispecies (Groundfish)
For More Information
Wave Buoy Placed in Cape Cod Bay (Cape Cod Times)
Real-time data from Cape Cod Bay wave buoy (NERACOOS)

