Overview
This map displays scallop abundance and scallop biomass from multiple data sources. Abundance means the number of individual scallops that were found. Biomass means the total weight of the scallops that were found.
Data Considerations
There are three regular surveys of the scallop stock on the Atlantic coast, two of which are shown here: the NOAA Northeast Fisheries Science Center (NEFSC) survey (dredge survey results shown) and the School of Marine Science and Technology (SMAST) at the University of Massachusetts Dartmouth survey (shown). The third regular survey is by the Virginia Institute of Marine Science (VIMS), which has conducted intensive dredge surveys within the Mid-Atlantic Bight each year since 2005 (as well as for 1999 and 2000) with the aid of the commercial scallop fishery. The VIMS survey data are currently not shown; the Northeast Ocean Data Working Group will coordinate with the Mid-Atlantic Regional Council on the Ocean Portal Working Group to obtain and display these data.
The NEFSC scallop survey data show scallop biomass in meat weights for every survey from 1966 through 2014. Meat weights are calculated from shell heights using a shell height-to-meat weight ratio (Hennen and Hart 2012). The NEFSC scallop survey program began in 1960 and had a major gear change in 1979. Since 1979 there have been other gear and vessel changes, for which the effects are generally small (Hart 2015). In cases where it was deemed appropriate after study, correction factors have been applied to the data. For more information see Hart (2015).
The NEFSC scallop survey uses a stratified random survey design for 15-minute tows with an 8-foot New Bedford scallop dredge with 2-inch rings and a 1.5-inch liner. The map below (Figure 1.4 from Hart 2015) shows the regularly sampled survey strata (blue), and the grey strata that were regularly sampled prior to 1989. The green strata were also regularly sampled prior to 1989, and the portions deeper than 40 meters (white lines show the 40-meter contour) have been regularly sampled since 2000. The red strata lie on the Canadian side of Georges Bank and have been surveyed in some years. The black dashed lines show the closed or rotational management areas.
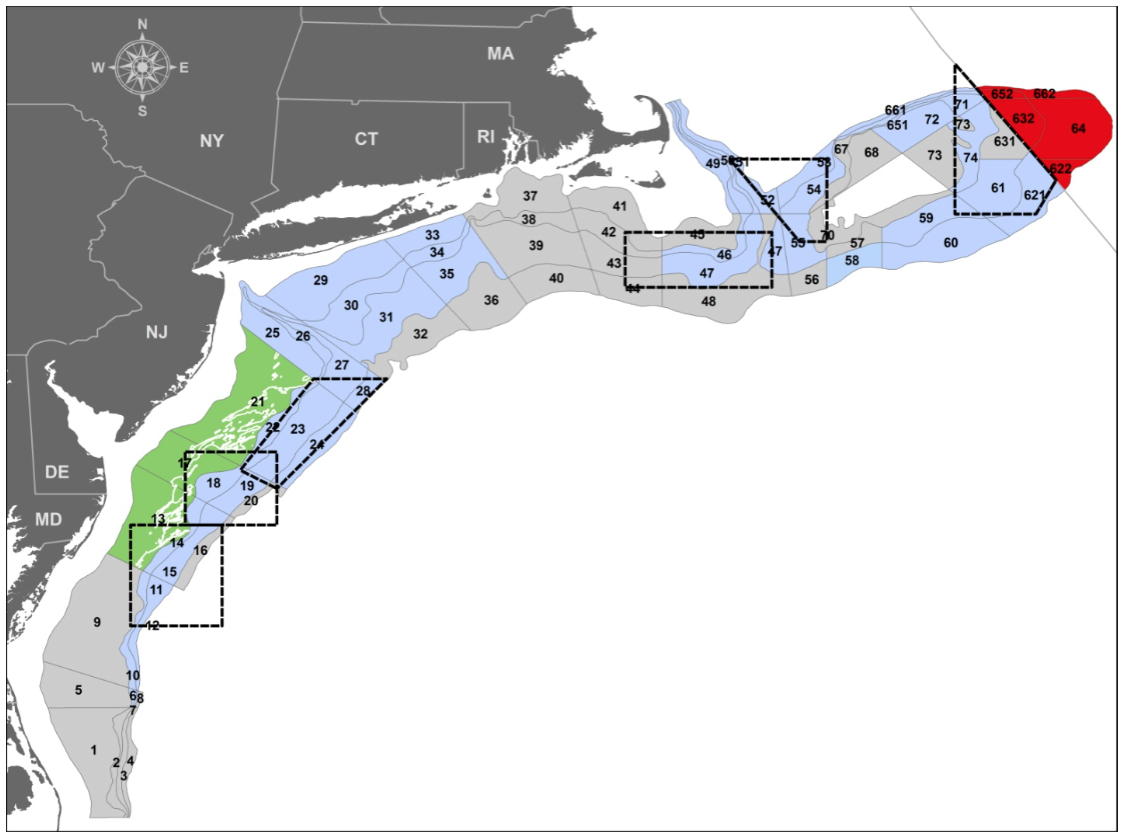
Click to enlarge
Other data that are collected during NEFSC scallop dredge surveys (but that are not shown here) include scallop shell heights; the number and height of dead scallop shells; finfish, cephalopods, and lobsters caught during the survey; and presence/absence of other bivalve species (e.g., ocean quahogs, razor clams) and invertebrate species (e.g., sand dollars, anemones). In coordination with its dredge survey, NEFSC has also conducted a camera survey of the scallop fishery, using HabCam, since 2011 on Georges Bank and since 2012 in the Mid-Atlantic.
The School of Marine Science and Technology (SMAST) at the University of Massachusetts Dartmouth, in collaboration with the commercial scallop fishery, has conducted underwater video surveys from the Canadian border to Virginia to assess scallop abundance since 1999, but with enhanced survey effort since 2003 (Stokesbury et al. 2015). Scallops and other organisms are counted in video frames and still images of the seafloor. The data shown here represent the average number of scallops counted at SMAST survey stations within a grid cell for the years 2003 through 2012. These data are displayed using the grid cells used by the New England Fishery Management Council’s Swept Area Seabed Impact tool, which are 10 kilometers by 10 kilometers. The survey provides important information about the Atlantic scallop stock and fishery, as well as data and information about sediment type (see Habitat > Physical > Sediment) and other benthic fauna (see Habitat > Biological > Other benthic fauna).
Scientists have analyzed similarities and differences among the results of the three major surveys. Comparisons between the NEFSC and VIMS surveys suggest that these two surveys have the same fishing power. Comparisons between the NEFSC and SMAST surveys show similar size frequencies of scallops caught, suggesting generally good agreement between patterns captured by these surveys. For more details and further references see Hart (2015).
Status
Coordination with partners in the Northeast and Mid-Atlantic regions to display scallop survey and management data is ongoing. Updates to the NEFSC scallop layer will be made annually as new data are added to the database.
Support for Regional Ocean Planning
For information about how these data and maps are being developed with stakeholder input and used to support regional ocean planning, please visit the marine life and habitat page on the Northeast Regional Planning Body’s website.
References Cited
Hart, D.R. 2015. Northeast Fisheries Science Center Scallop Dredge Surveys. Prepared for the Sea Scallop Survey Review, March 2015. NOAA/NMFS Northeast Fisheries Science Center, Woods Hole, MA. 40 pp.
Hennen, D.R. and Hart, D.R. 2012. Shell height-to-weight relationships for Atlantic sea scallops (Placopecten magellanicus) in offshore US waters. Journal of Shellfish Research 31: 1133-1144.
Stokesbury K.D.E., Adams E.K., Asci S.C., Bethoney N.D., Inglis S., Jaffarian T., Keiley E., Rosellon-Druker J.M., Malloy R. Jr., O’Keefe C. 2015. SMAST Sea scallop (Placopecten magellanicus) drop camera survey from 1999 to 2014. Report to the NEFSC Review of Scallop Survey Methodologies.