With the Northeast Regional Planning Body’s release today of the Draft Northeast Ocean Plan, Northeast Ocean Data announces the release of over 3,000 new maps of marine life to support ocean planning and management.
The maps show the distribution and abundance or biomass of
- 29 marine mammal species and species guilds (map),
- 40 bird species (map), and
- 82 fish species (map).
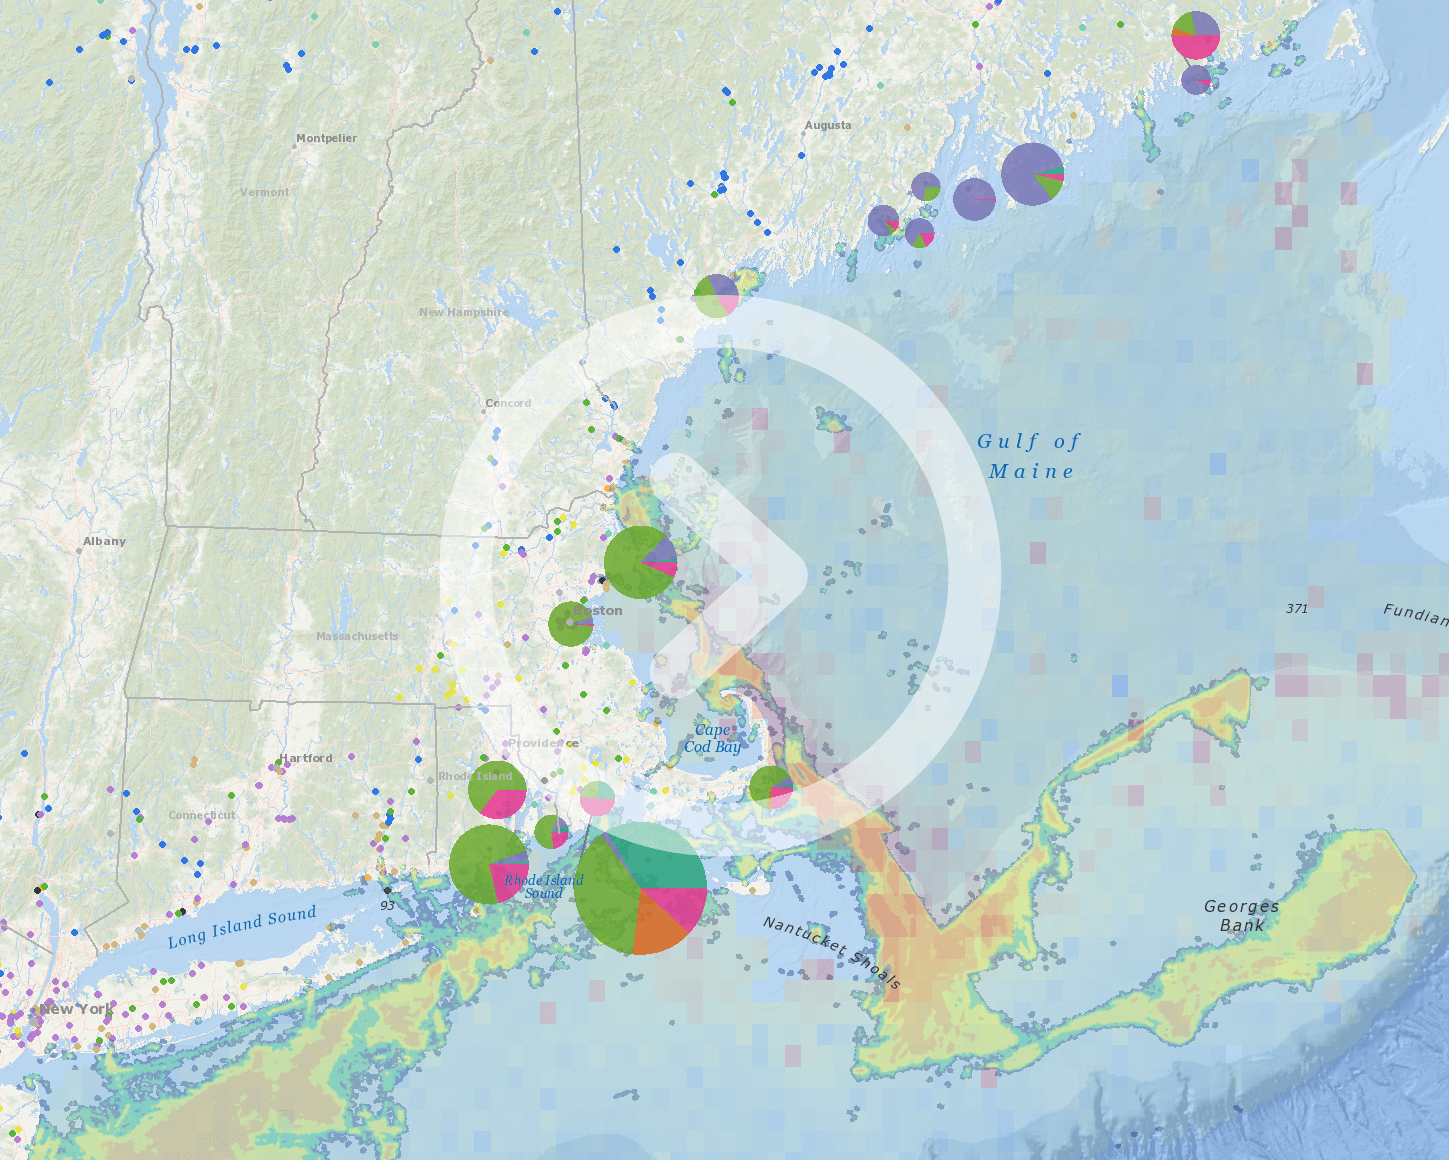
In addition to individual species, the maps show diversity, species richness, total abundance, and core abundance areas for groups of species that share regulatory, ecological, and stressor-sensitivity characteristics. These integrative maps are still being reviewed and revised, and they currently carry a “draft” watermark. They bring together the individual species data into new formats that can be helpful to agencies, scientists, conservation practitioners, and the public in understanding and making decisions that affect marine life in the Northeast ocean.
Produced by researchers at several institutions who work collaboratively as the Marine-life Data and Analysis Team (MDAT), this collection of new maps represents one of the largest known efforts globally to assemble and disseminate spatial data for multiple species and taxa of marine life.
Marine Mammal Maps
The Marine Geospatial Ecology Lab at Duke University led the overall MDAT effort and developed marine mammal maps for the entire Atlantic coast. The methods used to develop the marine mammal maps were published recently in the journal Nature Scientific Reports.

Bird Maps
The NOAA National Centers for Coastal Ocean Science developed the maps of marine bird abundance and distribution for the entire Atlantic coast. The methods used to produce the bird maps are published in a Bureau of Ocean Energy Management Office of Environmental Studies Program report.

Fish Maps
The NOAA Northeast Fisheries Science Center (NEFSC) mapped the biomass of fish species using data from their own 46-year trawl survey, as well as data from the states of Maine, New Hampshire, and Massachusetts, and data from the North East Area Monitoring and Assessment Program (NEAMAP). Collectively, the fish biomass data span the areas from Maine to Cape Hatteras, North Carolina. Information about the fish mapping methodology is available by clicking on the About tab on the Fish map or by visiting https://nefsc.noaa.gov/ecosys.

The MDAT work represents the collaborative efforts of many individuals and funders. More than 80 scientists and experts in the Northeast region from state and federal agencies, tribes, academia, conservation organizations, and research institutions contributed to developing and peer-reviewing the methodologies and results.